

Running a survey and simply looking at average percentages is useless if the results end up filed away in a drawer. The true value of a satisfaction survey lies not in data collection, but in deep interpretation and uncovering hidden patterns.
When you implement an organizational climate analysis strategically, you stop being a mere bystander to office chatter and become a proactive manager. Catching a negative trend in employee satisfaction early allows you to get ahead of turnover and boost business efficiency.
Below, you will discover the step-by-step methodology to transform raw data into strategic, profitable decisions for your organization.
Setting the Stage: Data Quality Before Analysis
Before looking for patterns and driving yourself crazy with charts, you must ensure the health of the survey so that your conclusions are valid. There is no use in designing a revolutionary action plan if the foundation of your information is shaky or lacks rigor. The first step is auditing the collected responses to ensure they reflect the reality of the entire workforce and not just an isolated group. Only when the data is clean and reliable can we move forward with total confidence toward decision-making.
Participation Rate and Representation
For the results of an employee satisfaction survey to have statistical validity, you should aim for a participation rate above 60%.

If your percentage is lower, you risk making decisions based on the opinions of a minority who are likely at the extremes—either highly satisfied or extremely angry. It is vital to segment participation by department to identify blind spots, such as night shifts or operational staff who didn’t respond.
If a key department has a 20% participation rate, the data for that section is not representative and should not be used to generalize.
Guarantee of Anonymity
Ensuring anonymity is fundamental to getting honest, unfiltered feedback from your people. If the team suspects their responses can be traced back to their names, they will alter their ratings out of fear of potential consequences. For this reason, data breakdowns must never allow an individual to be identified in visual reports.
In this regard, minimum groups of 3 to 5 people are recommended to safeguard confidentiality in any segmentation you perform.
5 Foolproof Techniques to Spot Patterns in Your Climate Survey
Once you have validated the quality of the collected data, it’s time to apply analytical methods to find hidden trends. This section is the core of your strategy, where technology and analytics come together to give you a privileged view of the organization’s true state.
To learn how to analyze the results of a workplace climate survey exceptionally well, you must go beyond surface-level readings. The following five techniques will allow you to structure the information to discover exactly what is hurting your organization.
1. Heatmaps for Quick Visualization
A workplace climate heatmap is the ideal tool for making an instant diagnosis without getting lost in endless spreadsheets. Using a highly intuitive color-coded system, the software highlights the best and worst-performing areas of the organization. Colors—such as dark green for the highest score and dark red for the lowest—allow you to identify strengths and critical pain points by department or cluster at a single glance.
This way, you’ll know in a second whether leadership is a company-wide issue or if it only affects a specific division. Team Insights incorporates interactive heatmaps that transform survey results into a quick, actionable visualization.
As a result, HR can identify in seconds which areas need immediate attention, which teams stand out positively, and where it makes sense to dig deeper before making decisions.
2. Data Cross-Referencing and Strategic Segmentation
True insight emerges when you cross-reference HR data, connecting global results with key demographic variables. Analyzing information by area, department, role, or tenure reveals realities that overall averages usually hide. Imagine cross-referencing this data with current team performance metrics.
If high performers have a low average score in compensation, there is an imminent risk of turnover; if they score low on emotional health, you have a serious workload issue. With Team Insights, this analysis is simplified thanks to automatic data segmentation and the ability to create custom segments. This allows you to tailor the reading of the results to your company’s actual structure and make much more precise decisions.
3. Dispersion and Standard Deviation Analysis
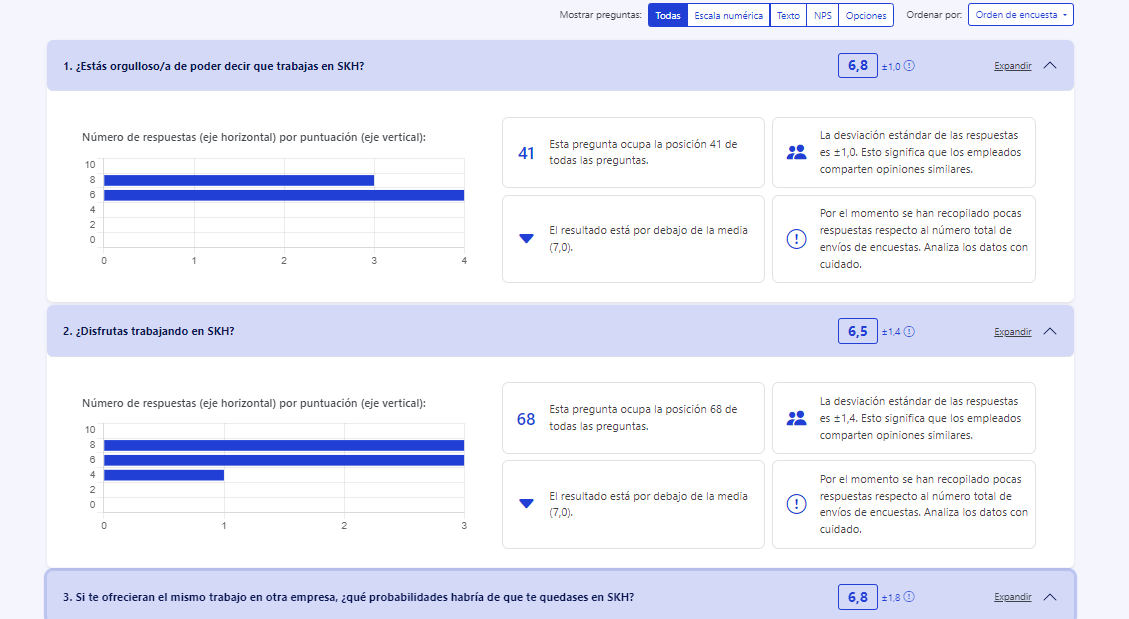
HR directors must learn not to get trapped in the overall average of the questions. Two departments can have an identical score of 7 out of 10, but their internal realities can be completely opposite if you analyze the variance of their responses. A high standard deviation in an answer means that opinions are highly polarized, indicating very different experiences within the same team.
This behavior is a high-priority red flag even if the overall average seems acceptable, as it shows a lack of internal equity. That’s why, in Team Insights, all answers include information about their standard deviation and dispersion level, allowing you to detect not only what score each area gets, but also how much consensus or polarization lies behind each result.
4. Sentiment Analysis for Open-Ended Questions
Processing hundreds of text comments manually is too time-consuming and often creates bias and inconsistencies based on the reviewer’s criteria.
The richness of natural language is lost without an optimized system to categorize feedback objectively. Artificial Intelligence and natural language processing allow you to automate sentiment analysis in surveys, classifying the emotional tone into positive, negative, or neutral.
This system helps detect widespread signs of unrest, burnout, frustration, or potential intent to leave among employees. Team Insights’ automatic sentiment analysis allows you to interpret open-ended comments quickly and in a structured way, helping you identify relevant emotional patterns without relying on a manual, comment-by-comment review.

5. Driver Identification (Correlations)
Not all questions in your questionnaire carry the same weight when it comes to building daily engagement or improving loyalty metrics.
Therefore, it is essential to discover which specific factors drive satisfaction in your company so you don’t scatter your investment efforts. Looking for which variables impact engagement the most allows you to understand the root cause of problems. For example, you can detect if a low score on work tools directly correlates with turnover intent in certain teams, allowing you to fix the source of the discontent.
Common Mistakes That Ruin Data Interpretation
Knowing what to do is just as important as knowing the most common missteps managers make when interpreting workplace climate surveys.
Falling into these analytical traps invalidates the team’s effort and damages the credibility of the process in the eyes of the workforce. When you learn to avoid these biases, your analysis gains rigor, and your action plans become highly effective. Let’s look at the mistakes you must avoid at all costs during your data review:
-
Staying on the average: Assuming the entire company is doing well because the average is acceptable, completely ignoring the problematic extremes of the organization.
-
Drawing conclusions from non-representative groups: Assuming trends and applying drastic changes in departments that had a very low response rate.
-
Personalizing criticism: Focusing on hunting down specific individuals instead of analyzing internal processes or general leadership behaviors.
-
Attributing false demographic biases: Mistakenly believing that a problem is due to age or gender when the pattern is actually driven by the conditions of the department they work in.
From Patterns to Action: How to Close the Loop with an Action Plan
Data analysis loses all meaning if it doesn’t translate into improvements that employees can experience in their day-to-day lives. If people fill out questionnaires and see no changes after the survey, participation will drop drastically in future rounds. To achieve this efficiently, you need a framework that structures the organization’s priorities.
Impact-Effort Matrix
You cannot fix all the company’s problems in a single week, so you need a tool to prioritize. The impact-effort matrix helps you organize initiatives visually to optimize your department’s available resources. We advise you to prioritize initiatives by grouping them into “quick wins”—which offer high impact with low effort—and structural projects that will require long-term development.
Starting with quick wins demonstrates immediate commitment and reinforces employee trust.
Setting SMART Goals and Tracking Metrics
Every improvement initiative you decide to launch must be perfectly defined to prevent it from dissolving into the daily routine. A plan without structure becomes a statement of good intentions that rarely leads anywhere. The action plan must have clear owners on the team, strict deadlines, and management indicators to evaluate whether the negative pattern is being successfully reversed.
Monitoring these indicators ensures that the measures adopted are generating the expected financial and human impact.
Pulse Surveys
Waiting twelve full months to check if the measures you implemented have taken effect is a mistake that weakens your people management strategy. The market and employee morale change too quickly to rely on a single annual snapshot. At Team Insights, we suggest launching short pulse surveys every 4 to 8 weeks, focusing exclusively on the areas where critical patterns were detected, to evaluate improvement.
This continuous tracking allows you to correct course in real time and constantly optimize metrics to retain talent. With Team Insights’ pulse surveys, you will shift from a one-time measurement to continuous listening, validating in real time whether the actions taken are improving the employee experience.
Conclusion
Interpreting workplace climate surveys exceptionally well means moving from data to action with rigor, consistency, and a clear business vision.
With Team Insights, the data works for you, allowing you to focus all your energy on leading teams and designing high-performance strategies.
Want to transform your company’s analysis and protect your team? Request a demo of our Team Insights workplace climate software. Our platform automates pattern detection, cross-references data in real time, and offers advanced sentiment analytics without requiring any technical expertise.
Try Team Insights for free here and revolutionize your talent management.

